- Home
- blood sugar levels
- chart levels
Chart of blood sugar levels
A blood sugar level chart for adults with diabetes helps organize fasting, before-meal, after-meal, bedtime, exercise, and illness-related readings so repeated patterns are easier to recognize.
Written by: Dr. Albana Greca, MD, MMedSc, Family Physician and Medical Author.
Medically reviewed by: Dr. Ruden Cakoni, MD, Endocrinologist.
Last reviewed: July 2026.
Quick Answer
A blood sugar chart helps you organize glucose readings by date, time, meal, medicine, activity, illness, and symptoms. The main benefit is not comparing every result with a single “normal” number—it is identifying repeated patterns that you and your diabetes care team can use safely.
For many nonpregnant adults with diabetes, common treatment targets are 80–130 mg/dL (4.4–7.2 mmol/L) before meals and below 180 mg/dL (10.0 mmol/L) one to two hours after the start of a meal. These are general targets, not diagnostic ranges or universal personal goals. Do not adjust insulin or diabetes medicine from a chart unless you are following a written plan provided by your clinician.
A single glucose reading is a snapshot. A blood sugar log records many snapshots, while a chart turns those readings into a visible pattern. This can reveal morning highs, meal-related spikes, overnight lows, exercise effects, sick-day changes, and whether a recent treatment adjustment appears to be helping.
The former version of this page advised readers to adjust diabetes-drug doses directly from their chart. That advice was unsafe and has been removed. A chart can support treatment decisions, but medication changes require an individualized correction plan or review by the prescribing clinician.
Blood Sugar Treatment Target Chart
The following targets are commonly used for many nonpregnant adults who already have diabetes. They should not be used to diagnose diabetes, and they may not be appropriate for children, pregnancy, frail older adults, people with frequent hypoglycemia, or those with significant medical conditions.
| Timing or situation | Common target or threshold | mmol/L | How to interpret it |
|---|---|---|---|
| Before meals | 80–130 mg/dL | 4.4–7.2 | A common target for many nonpregnant adults with diabetes |
| 1–2 hours after the start of a meal | Below 180 mg/dL | Below 10.0 | Used when after-meal monitoring is part of the plan |
| Low-glucose alert | Below 70 mg/dL | Below 3.9 | Take prompt action according to the hypoglycemia plan |
| Clinically significant low | Below 54 mg/dL | Below 3.0 | Requires immediate treatment and review of the cause |
| Bedtime or overnight | Individualized | Individualized | Depends on insulin, recent activity, low-glucose risk, pregnancy, and other factors |
Important: “Normal,” “diagnostic,” and “treatment target” ranges are not interchangeable. A person without diabetes has different physiology from someone safely managing diabetes with insulin or medicine.
Laboratory Ranges Used to Diagnose Prediabetes and Diabetes
Home meter and CGM readings can reveal a concerning pattern, but diabetes diagnosis is made with validated laboratory tests. Unless hyperglycemia is unmistakable or a crisis is present, an abnormal result usually requires confirmation.
| Laboratory test | Normal range | Prediabetes range | Diabetes range |
|---|---|---|---|
| Fasting plasma glucose After at least 8 hours without calories |
Below 100 mg/dL Below 5.6 mmol/L |
100–125 mg/dL 5.6–6.9 mmol/L |
126 mg/dL or higher 7.0 mmol/L or higher |
| 2-hour 75-g oral glucose tolerance test | Below 140 mg/dL Below 7.8 mmol/L |
140–199 mg/dL 7.8–11.0 mmol/L |
200 mg/dL or higher 11.1 mmol/L or higher |
| HbA1c | Below 5.7% | 5.7–6.4% | 6.5% or higher |
| Random plasma glucose | No single universal normal cutoff for diagnosis | No defined prediabetes cutoff | 200 mg/dL or higher with classic symptoms or hyperglycemic crisis |
Pregnancy uses different testing pathways and targets. HbA1c may also be unreliable in anemia, recent blood loss or transfusion, pregnancy, kidney disease, and some hemoglobin conditions.
See our full guide to blood tests for diabetes and prediabetes.
How a Blood Sugar Log and Chart Work Together
A log records each value and its context. A chart plots those values so you can see direction, repetition, and variability.
A useful entry may include:
- Date and exact time
- Glucose value and unit
- Fasting, before meal, after meal, bedtime, overnight, exercise, illness, or symptoms
- What and how much you ate
- Medication or insulin and when it was taken
- Physical activity
- Stress, pain, infection, poor sleep, menstruation, or steroid medicine
- Symptoms of high or low glucose
- Ketone result when testing is advised
Use a consistent time frame. A one-week chart can help evaluate a specific meal or medicine change. A two- to four-week chart is often better for broader patterns. Long charts with hundreds of ungrouped readings can be difficult to interpret.
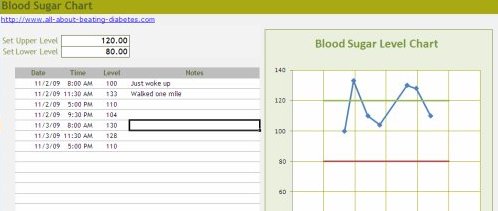
Enter personal target lines only after confirming them with your clinician. The files are educational tools and do not calculate insulin or diagnose diabetes.
Interactive Blood Sugar Chart
Add up to 30 recent readings. The chart is stored only in this browser using local storage and is not sent to the website.
| Date/time | Reading | Timing | Note | Remove |
|---|---|---|---|---|
| No readings entered yet. | ||||
The default target lines are educational examples, not personal instructions. Change them only to match targets agreed with your healthcare professional.
How to Measure Blood Sugar More Accurately
A chart is only as useful as the measurements entered into it. To reduce avoidable errors:
- Wash your hands with soap and water and dry them thoroughly. Sugar, fruit, or food residue on the fingers can cause a falsely high result.
- Use the correct strips for the meter. Check the expiration date and storage instructions.
- Follow the meter instructions. Use an adequate blood sample and apply it in the correct way.
- Keep the meter and strips away from heat, humidity, and extreme cold.
- Use control solution when instructed or when a new strip container is opened, the meter is dropped, or results seem unreliable.
- Repeat an unexpected result. If symptoms do not match the number, wash and dry your hands and check again.
- Use a finger-stick meter when a CGM result does not match symptoms or when the device instructs you to confirm it.
Home meters are useful but are not identical to laboratory instruments. Severe dehydration, anemia, shock, an abnormal hematocrit, altitude, medicines, or incorrect technique can affect some readings.
When Should You Check?
The schedule depends on diabetes type, medicines, insulin, pregnancy, hypoglycemia risk, use of CGM, and the information needed.
Possible times include:
- When waking or fasting
- Before meals
- One to two hours after the start of a meal
- Before driving when low-glucose risk is present
- Before, during, or after exercise
- At bedtime or overnight
- During illness
- When symptoms suggest high or low glucose
- After a medication, insulin, meal, or activity change
More testing is not automatically better. Each check should answer a useful question or support a treatment decision. People with type 2 diabetes who do not use insulin may benefit from structured testing at selected times rather than random frequent checks without a plan.
How to Read Patterns in Your Chart
Repeated Morning Highs
Possible contributors include the dawn phenomenon, insufficient overnight insulin, a late meal, poor sleep, illness, stress, steroid treatment, or—in some insulin users—an overnight low followed by recovery. Check several nights and mornings before assuming the cause.
See why blood sugar may be high in the morning.
High After-Meal Readings
Review the carbohydrate amount, meal composition, timing of medication or insulin, missed doses, activity, and whether the measurement was taken one or two hours after the start of the meal. One unusual meal does not establish a pattern.
Late Drops After Exercise
Physical activity can increase insulin sensitivity for hours. People using insulin, sulfonylureas, or meglitinides may have delayed hypoglycemia. Record the type and duration of activity and follow the exercise plan provided by the diabetes team.
Large Swings
Averages can look acceptable even when highs and lows alternate. Review meal timing, insulin dosing, correction stacking, alcohol, gastroparesis, exercise, injection sites, CGM accuracy, and medication timing.
Readings That Do Not Match HbA1c
The meter schedule may miss overnight or after-meal periods. HbA1c can also be affected by anemia, blood loss, transfusion, kidney disease, pregnancy, and hemoglobin conditions. Compare the chart, HbA1c, and CGM or laboratory data together.
What to Do With an Unexpected High Reading
- Wash and dry your hands and repeat the test if contamination or an error is possible.
- Check whether medicine or insulin was missed, delayed, expired, overheated, or incorrectly administered.
- Follow your written correction or sick-day plan.
- Drink water when appropriate and not restricted by your clinician.
- Check ketones when advised, especially during illness or with marked hyperglycemia.
- Contact the diabetes team when high readings repeat, remain above the personal action threshold, or occur with illness.
Do not take extra insulin by guessing. Repeated corrections given too close together can cause delayed severe hypoglycemia.
What to Do With a Low Reading
Blood glucose below 70 mg/dL (3.9 mmol/L) is considered low for many people with diabetes and should be treated promptly according to the personal plan.
For a conscious person who can swallow safely, a common approach is the 15-15 rule:
- Take 15 grams of fast-acting carbohydrate.
- Wait 15 minutes.
- Check again.
- Repeat if the glucose remains below 70 mg/dL.
Examples include glucose tablets or gel, measured juice, or regular—not diet—soda. Chocolate and high-fat foods act more slowly and are not ideal first treatment.
Severe hypoglycemia, unconsciousness, seizure, or inability to swallow safely requires glucagon when available and emergency assistance. Do not put food or liquid into the mouth of an unconscious person.
When High Blood Sugar May Be an Emergency
High glucose becomes more concerning when accompanied by ketones, vomiting, dehydration, abdominal pain, confusion, deep or difficult breathing, fruity-smelling breath, or inability to keep fluids down.
CDC advises emergency assessment when blood glucose remains at 300 mg/dL or higher with signs of diabetic ketoacidosis. A person can also develop ketoacidosis at lower glucose levels, particularly during pregnancy or when using an SGLT2 inhibitor.
Go to emergency care or call local emergency services for:
- Moderate or large ketones with concerning symptoms
- Repeated vomiting or inability to keep fluids down
- Deep, rapid, or difficult breathing
- Fruity-smelling breath
- Severe dehydration
- Confusion, fainting, or extreme drowsiness
- Seizure or unconsciousness
- Chest pain or stroke symptoms
How to Share Your Chart With Your Doctor
Bring or send a focused summary rather than only a long list of numbers. Include:
- The dates covered
- Your personal glucose targets
- How often you checked and why
- Repeated fasting, after-meal, overnight, or exercise patterns
- All low readings and how they were treated
- Ketone results and illness
- Current medicines and insulin doses
- Missed doses or practical difficulties
- Changes in food, activity, weight, sleep, stress, or steroid use
- Questions you want answered
Averages alone can hide important variability. Highlight the highest and lowest readings, but also show the surrounding context.
Blood Sugar Charts During Pregnancy
Pregnancy uses tighter glucose targets and requires prompt professional guidance. Do not use the general adult targets on this page as a gestational-diabetes or pre-existing diabetes pregnancy plan.
Record fasting and post-meal values at the exact times requested by the obstetric or diabetes team. Include meals, insulin, activity, ketones, vomiting, and any difficulty eating.
Blood Sugar Charts for Children and Older Adults
Children require age-appropriate targets, caregiver planning, school safety, and special attention to activity and overnight lows.
Older adults may need safer, less stringent targets when hypoglycemia, cognitive impairment, frailty, kidney disease, falls, or complex medication schedules create greater risk. Personalized targets are more important than forcing every reading into a narrow range.
Important Safety Note
Never adjust insulin or diabetes medicine solely because a chart line is above or below a general target. Use only the correction, carbohydrate, sick-day, or medication plan prescribed for you.
Severe low glucose, unconsciousness, seizure, inability to swallow, vomiting with ketones, deep breathing, fruity breath, severe dehydration, confusion, chest pain, or stroke symptoms requires urgent or emergency care.
Doctor’s Note
A useful blood sugar chart does not ask, “Was I good or bad today?” It asks, “What pattern is repeating, what may explain it, and what is the safest next step?” I recommend separating fasting, before-meal, after-meal, overnight, exercise, and illness readings so that treatment decisions are based on comparable situations.
Most Asked Questions
What is a normal blood sugar level?
For diagnosis, normal fasting laboratory glucose is below 100 mg/dL and normal two-hour glucose after a 75-g oral glucose tolerance test is below 140 mg/dL. Daily treatment targets for someone who already has diabetes are different and individualized.
What should blood sugar be before meals?
For many nonpregnant adults with diabetes, a common target is 80–130 mg/dL. Your personal range may be different.
What should blood sugar be two hours after eating?
A common treatment target for many nonpregnant adults with diabetes is below 180 mg/dL one to two hours after the start of a meal.
Is 120 mg/dL before a meal good?
It falls within the common 80–130 mg/dL premeal target for many adults with diabetes. Interpretation depends on your personal goal, symptoms, medicine, and repeated pattern.
Can a blood sugar chart diagnose diabetes?
No. A chart may identify a concerning pattern, but diagnosis requires validated laboratory testing and appropriate confirmation.
How many days should I record?
One to two weeks can reveal many patterns. A clinician may request a different schedule depending on the question, treatment, and monitoring method.
Should I adjust insulin from the chart?
Only when following a written insulin-to-carbohydrate ratio, correction factor, pump setting, or titration plan provided by your diabetes clinician. Do not invent dose changes from general internet targets.
Why does my meter differ from my CGM?
A meter measures capillary blood glucose while a CGM measures glucose in interstitial fluid. Timing, rapid glucose change, sensor lag, technique, and device accuracy can cause differences.
Should I record readings in mg/dL or mmol/L?
Use the unit standard in your country and keep it consistent. To convert mg/dL to mmol/L, divide by 18. To convert mmol/L to mg/dL, multiply by 18.
Educational safety note: This page provides general diabetes education and charting tools. It does not replace personal medical advice, diagnosis, glucose-monitoring instructions, or treatment. Do not start, stop, or change insulin, diabetes medicines, supplements, diet, or exercise based only on this chart.
Related Questions
- How Do I Keep My Blood Sugar From Crashing?
- Do Random Glucose 117, Fasting 147, and Average 128 Show Diabetes?
- What Causes Fluctuating Blood Sugar Ranges?
- Why Is Fasting Glucose Higher Than My Two-Hour Reading?
- How Should a Blood Sugar Chart Be Interpreted With Alcohol Use?
Related Resources
- Blood Sugar Levels by Time of Day
- Normal Blood Sugar Level Chart
- Printable Diabetic Blood Sugar Chart
- Blood Sugar Log Sheet
- Is My Blood Sugar Too High or Too Low?
- Dangerous Blood Sugar Levels
- Convert mmol/L to mg/dL
- HbA1c Explained
References
- American Diabetes Association Professional Practice Committee. Glycemic Goals, Hypoglycemia, and Hyperglycemic Crises: Standards of Care in Diabetes—2026.
- American Diabetes Association. Checking Your Blood Sugar.
- Centers for Disease Control and Prevention. Monitoring Your Blood Sugar.
- Centers for Disease Control and Prevention. Manage Blood Sugar.
- Centers for Disease Control and Prevention. Low Blood Sugar (Hypoglycemia).
- Centers for Disease Control and Prevention. Diabetic Ketoacidosis.
- National Institute of Diabetes and Digestive and Kidney Diseases. Diabetes Tests and Diagnosis.
- National Institute of Diabetes and Digestive and Kidney Diseases. Managing Diabetes.
- U.S. Food and Drug Administration. Blood Glucose Monitoring Devices.
- U.S. Food and Drug Administration. Getting the Most Out of Your Blood Glucose Meter.