- Home
- blood sugar levels
- How to Calculate Estimated Average Glucose From A1C
How is A1C and eAG calculated?
If you live with diabetes, it is understandable to want a simple answer to the question, “What blood sugar should I aim for?”
For many adults, there are well-established treatment targets. However, I always remind my patients that these are general goals, not one-size-fits-all rules. Your safest target depends on your age, type and duration of diabetes, medicines, risk of hypoglycemia, pregnancy status, kidney or heart disease, and overall health.
The goal is not to keep glucose at one perfect number all day. It is to remain within a safe range as consistently as possible while avoiding prolonged high blood sugar and unnecessary low blood sugar.
Quick Answer: Common Blood Glucose Targets
For many nonpregnant adults with diabetes, commonly used treatment goals are:
- Before meals: 80–130 mg/dL (4.4–7.2 mmol/L)
- Peak after meals: below 180 mg/dL (below 10.0 mmol/L), measured 1–2 hours after the beginning of the meal
- A1C: below 7% (below 53 mmol/mol), when this can be achieved safely
| Measurement | Common target | What it means |
|---|---|---|
| Before meals | 80–130 mg/dL (4.4–7.2 mmol/L) |
A common premeal target for many nonpregnant adults |
| Peak after meals | Below 180 mg/dL (below 10.0 mmol/L) |
Usually assessed 1–2 hours after the beginning of the meal |
| A1C | Below 7% (below 53 mmol/mol) |
A common longer-term goal when it can be reached safely |
What Does “Acceptable Blood Glucose” Mean?
An acceptable blood glucose level is not necessarily the same as a “normal” glucose level in someone without diabetes.
When we set a diabetes target, we balance two priorities: keeping glucose low enough to reduce the risk of long-term complications while avoiding hypoglycemia and treatment that is too aggressive for the individual patient.
A single blood glucose reading does not provide a complete picture of diabetes control. In clinical practice, I consider the broader pattern, including fasting and premeal glucose levels, post-meal readings when appropriate, A1C, episodes of hypoglycemia, symptoms, current medications, and, when available, continuous glucose monitoring (CGM) data. These measures should also be interpreted in the context of established blood glucose and A1C ranges for normal glucose, prediabetes, and diabetes.
Acceptable Blood Glucose Before Meals
For many nonpregnant adults with diabetes, a common target before meals is 80–130 mg/dL (4.4–7.2 mmol/L).
This gives us useful information about your baseline glucose before food begins to raise it. If most of your premeal readings are within your agreed target, that is encouraging, but they should still be interpreted together with your post-meal pattern, A1C, low-glucose episodes and overall treatment plan.
A reading of 80 mg/dL is not hypoglycemia. It is near the lower end of the usual premeal target. Hypoglycemia is generally defined as glucose below 70 mg/dL.
If fasting or premeal readings are repeatedly above your personal target, possible contributors include overnight glucose production, meal or medication timing, illness, poor sleep, stress and changes in physical activity. A pattern over several days is more informative than one isolated morning reading.
If morning glucose is your main concern, see our guide to fasting blood sugar levels.
Acceptable Blood Glucose After Meals
For many adults with diabetes, a common target is a peak post-meal glucose below 180 mg/dL (10.0 mmol/L).
When post-meal glucose is being assessed, it is generally measured 1–2 hours after the beginning of the meal. The timing matters because this period is intended to capture glucose near its post-meal peak.
One reading slightly above 180 mg/dL does not necessarily mean your treatment is failing. A larger meal, more carbohydrate than usual, illness, stress, poor sleep or reduced activity can all affect the result. More important questions are whether higher readings occur frequently, remain elevated for a long time, or appear alongside an A1C or CGM pattern showing excessive glucose exposure.
Because blood glucose changes throughout the day, the timing of a measurement matters, particularly when interpreting blood sugar levels after eating.
How Does A1C Fit With Daily Blood Sugar Targets?
Daily readings show what your blood sugar is doing at a particular moment. A1C provides a broader view of glucose exposure over the previous two to three months, with more recent weeks contributing more to the result.
For many nonpregnant adults with diabetes, a common A1C goal is below 7% (53 mmol/mol) when it can be achieved safely. Some people may benefit from a lower goal. Others need a less stringent goal because hypoglycemia, frailty, serious comorbidities, cognitive or functional limitations, or treatment burden makes tighter control less safe.
I would not interpret A1C in isolation. Two people can have the same A1C while experiencing very different patterns of highs and lows.
Learn more in A1C vs Blood Sugar, or use our HbA1c to Average Glucose Calculator.
What If I Use a Continuous Glucose Monitor?
A continuous glucose monitor, or CGM, helps us look beyond individual fingerstick readings. It shows how much time glucose spends within, above and below the target range.
| CGM metric | Common goal for many adults |
|---|---|
| Time in range: 70–180 mg/dL | More than 70% of the time |
| Time below 70 mg/dL | Less than 4% of the time |
| Time below 54 mg/dL | Less than 1% of the time |
| Time above 180 mg/dL | Less than 25% of the time |
CGM goals also need to be individualized. Some older adults with complex health problems, for example, may need more permissive goals to reduce the risk of hypoglycemia.
What About Bedtime Blood Sugar?
There is no single bedtime glucose target appropriate for every adult with diabetes. Bedtime goals depend on insulin use, risk of overnight hypoglycemia, age, other medical conditions, recent exercise, meal timing and the treatment plan you follow.
If you use insulin or medicines that can cause hypoglycemia, your clinician may give you a specific bedtime target. Follow that individualized plan rather than relying on a universal bedtime number from the internet.
What Is Considered Low Blood Sugar?
For people with diabetes, glucose below 70 mg/dL (3.9 mmol/L) is considered hypoglycemia and should be taken seriously. A level below 54 mg/dL (3.0 mmol/L) is more clinically significant.
Symptoms may include shakiness, sweating, hunger, palpitations, dizziness, weakness, irritability, confusion or difficulty concentrating. If you have a hypoglycemia treatment plan, follow it promptly. Frequent low readings require medical review because medication dose, meal timing or activity may need adjustment.
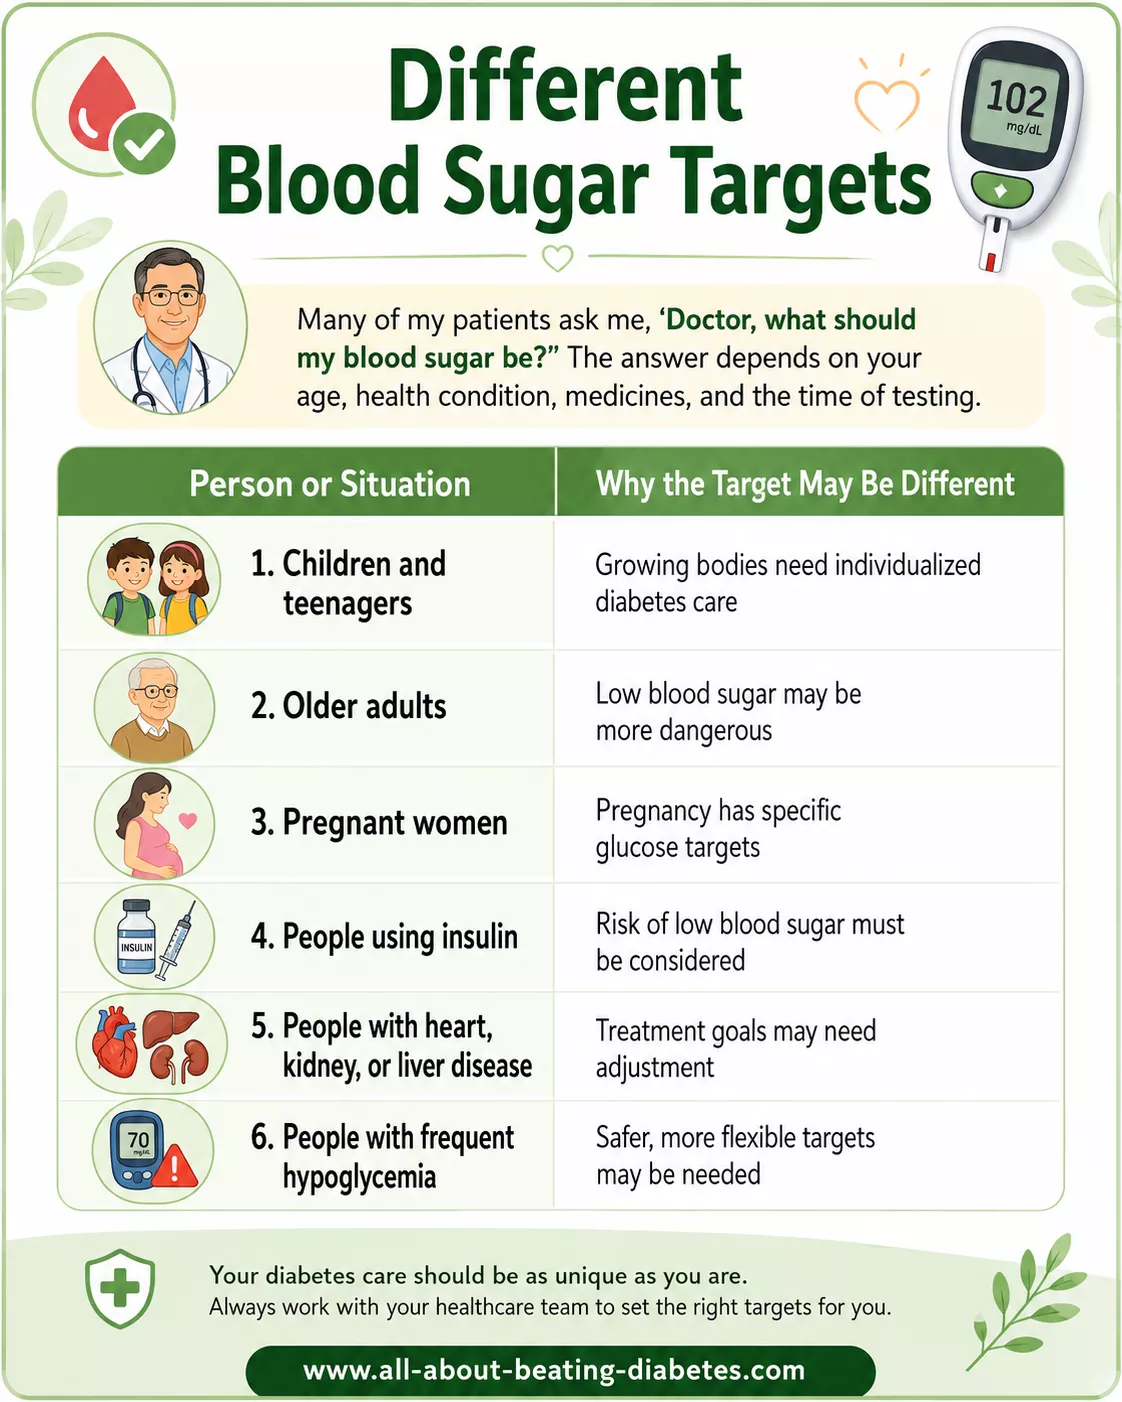
Why Your Personal Target May Be Different
I would not give exactly the same glucose goal to every patient. Your targets may need to be individualized if you:
- are pregnant or planning pregnancy;
- are a child or adolescent;
- are an older adult;
- have frequent or severe hypoglycemia;
- have impaired awareness of low blood sugar;
- have significant kidney, heart, liver or other medical disease;
- have cognitive or functional limitations;
- have lived with diabetes for many years; or
- use insulin or medicines that increase hypoglycemia risk.
An older adult who is otherwise healthy may still have relatively tight glucose goals. Someone with frailty, several serious illnesses or recurrent hypoglycemia may need more relaxed targets because preventing low blood sugar becomes the greater priority.
What Can Affect Your Blood Glucose Readings?
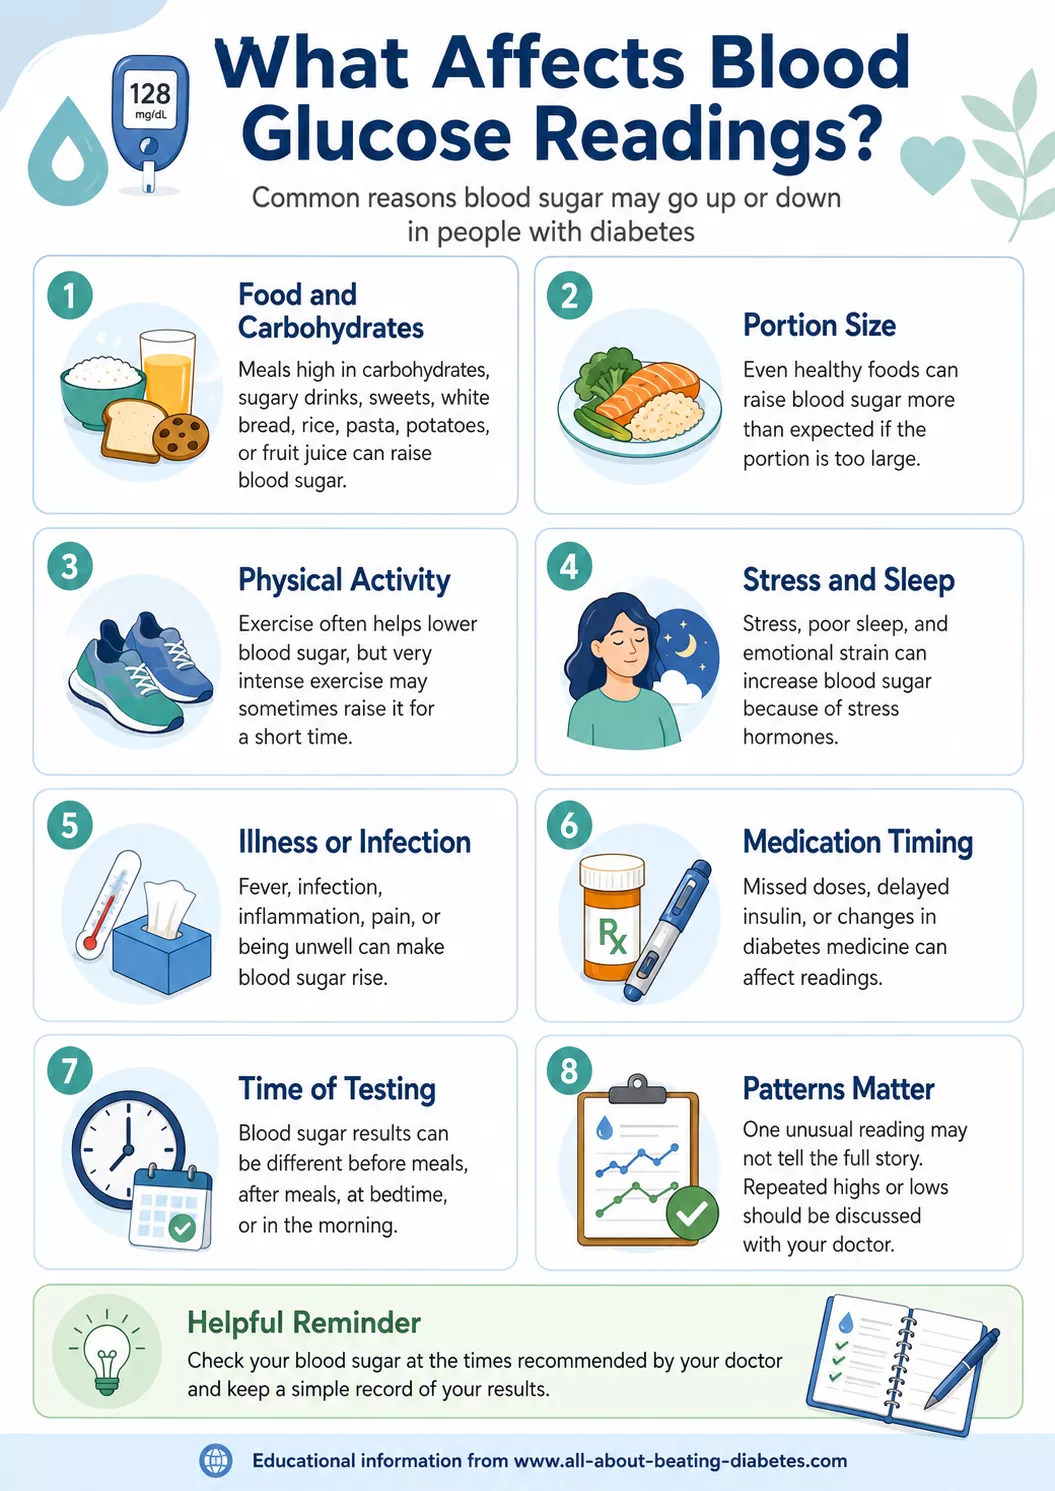
Even when your treatment plan has not changed, glucose can vary from day to day. Common influences include:
- meal size and carbohydrate content;
- physical activity;
- stress and sleep;
- infection, illness or pain;
- dehydration or alcohol;
- hormonal changes;
- medication timing;
- missed insulin or diabetes medicine; and
- corticosteroids and some other medicines.
This is why I encourage patients to look for patterns rather than reacting strongly to one unusual result.
How to Keep Blood Glucose Closer to Your Target
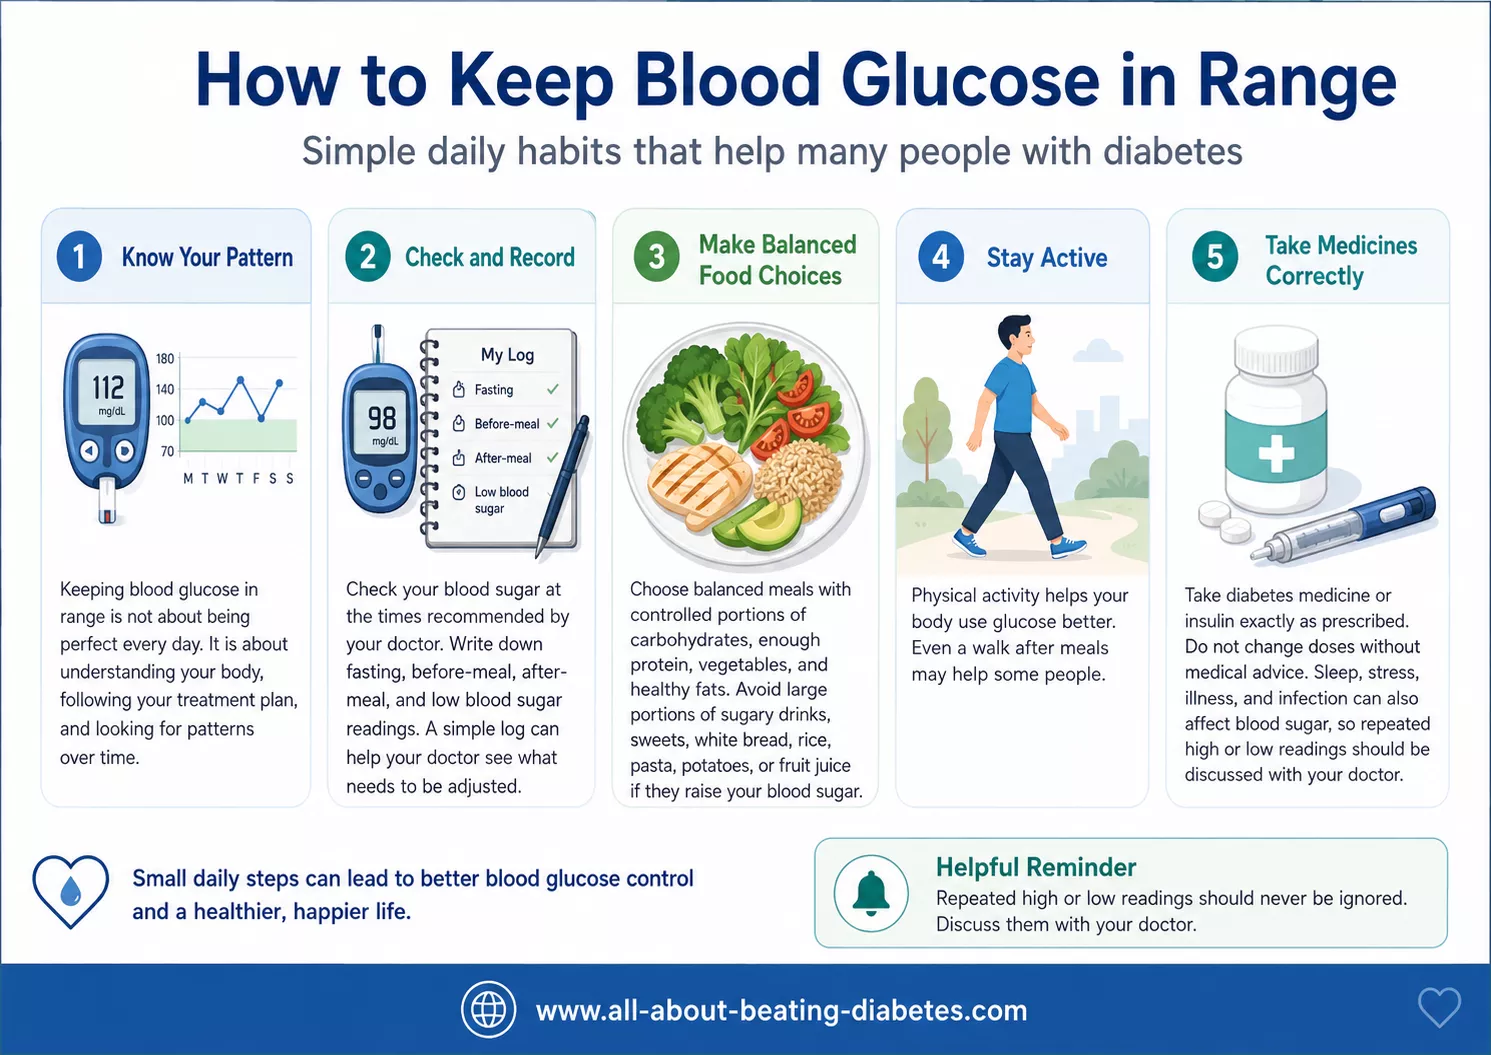
Keeping glucose in range does not require perfect numbers every day. The practical goal is to make the overall pattern safer and more consistent. Depending on your treatment plan, helpful steps may include:
- taking insulin or diabetes medicine exactly as prescribed;
- checking glucose at the times recommended by your healthcare team;
- keeping carbohydrate portions reasonably consistent when this is part of your plan;
- choosing meals with vegetables, protein, fiber and appropriate carbohydrate portions;
- being physically active regularly;
- reviewing repeated highs or lows instead of changing medication on your own;
- paying attention to sleep, illness, stress and hydration; and
- bringing your glucose log or CGM report to medical appointments.
Do not change insulin or medication doses because of one unusual result unless your healthcare professional has given you a specific adjustment plan.
Dr. Albana’s Perspective
When a patient asks whether a blood sugar number is “acceptable,” I first ask when it was measured and what target we agreed on for that person.
A premeal glucose of 125 mg/dL may be within the usual target for many adults with diabetes. The same number means something different if we are discussing a fasting laboratory test used to screen a person who has not been diagnosed with diabetes.
I also do not judge diabetes control from one good reading or one bad reading. I want to know whether most values are reasonably close to target, whether there are repeated highs, whether low glucose is occurring, and whether the A1C or CGM report tells the same story.
The best target is not the lowest number you can achieve. It is the range that offers meaningful long-term protection while remaining safe and realistic for your health and treatment.
When Should You Contact Your Doctor?
Contact your healthcare team if:
- glucose is repeatedly above your agreed target;
- you have repeated readings below 70 mg/dL;
- you experience nighttime hypoglycemia;
- your A1C is rising despite apparently reasonable daily readings;
- your CGM shows frequent highs or lows;
- you are ill and glucose becomes difficult to control;
- you are unsure whether medication or insulin needs adjustment; or
- your target may no longer be appropriate because of pregnancy, aging or a new medical condition.
Related Questions
Is 130 mg/dL acceptable for someone with diabetes?
It depends on when it was measured. For many nonpregnant adults, 130 mg/dL is at the upper end of the common premeal target. After a meal, it may also be within an acceptable range, but your individual target may differ.
Is 180 mg/dL after eating acceptable?
For many adults with diabetes, the common goal is a peak post-meal glucose below 180 mg/dL, assessed 1–2 hours after the beginning of the meal. Frequent readings at or above this level should be reviewed as a pattern.
Is 70 mg/dL acceptable?
Seventy mg/dL is the threshold at which we become concerned about hypoglycemia. A reading below 70 mg/dL should be treated according to your diabetes plan, and repeated lows should be discussed with your healthcare team.
Should everyone with diabetes have the same glucose target?
No. Age, pregnancy, medications, hypoglycemia risk, kidney or heart disease, functional status and other health conditions can all affect the safest goal.
What should my blood sugar be at bedtime?
There is no universal bedtime target for every adult with diabetes. Your bedtime goal should reflect your treatment plan, especially if you use insulin or are at risk of overnight hypoglycemia.
Is A1C below 7% right for everyone?
No. Below 7% is a common goal for many nonpregnant adults, but some people may benefit from a lower goal and others need a less stringent one for safety.
Related Tools and Calculators
Related Resources
Final Key Message
For many nonpregnant adults with diabetes, common treatment goals are 80–130 mg/dL before meals, below 180 mg/dL at the peak after meals, and A1C below 7% when these goals can be achieved safely.
If you use CGM, spending more than 70% of the time between 70 and 180 mg/dL is a common goal for many adults, while time below 70 mg/dL should remain limited.
Most importantly, your target should fit you. A safe plan balances glucose control with your risk of hypoglycemia, medications, age, other medical conditions and daily life. I would rather see a patient follow a realistic, individualized target safely and consistently than chase a “perfect” number that creates unnecessary risk.
References
- American Diabetes Association Professional Practice Committee. Glycemic Goals, Hypoglycemia, and Hyperglycemic Crises: Standards of Care in Diabetes—2026. Diabetes Care. 2026;49(Suppl. 1).
- American Diabetes Association Professional Practice Committee. Older Adults: Standards of Care in Diabetes—2026. Diabetes Care. 2026;49(Suppl. 1).
- American Diabetes Association. Checking Your Blood Sugar.
- National Institute of Diabetes and Digestive and Kidney Diseases. Managing Diabetes. National Institutes of Health.
Medical disclaimer: This information is for general education and does not replace professional medical advice, diagnosis or treatment. Follow the glucose targets and treatment plan recommended by your healthcare professional. Do not change insulin or diabetes medication doses without appropriate medical guidance.
Written by: Dr. Albana Greca Sejdini, MD, MMedSc
Medically reviewed by: Dr. Ruden Cakoni, MD, Endocrinologist
Last medically reviewed: July 2026
HbA1c and estimated average glucose describe the same general period of glucose exposure in different units. HbA1c is measured from glycated hemoglobin in a blood sample. eAG is not measured directly; it is calculated from HbA1c using a regression formula.
A1C and eAG Calculator
Convert A1C to estimated average glucose, or convert a true average glucose value back to an estimated A1C. Do not enter one fasting or after-meal reading as though it were an average.
A1C → eAG
Average Glucose → Estimated A1C
Educational limitation: The formulas describe the average relationship found in the ADAG study. Individual A1C may be higher or lower than the calculated value because of red-blood-cell biology, hemoglobin variants, kidney disease, pregnancy, glucose variability, measurement differences, and other factors.
Need only a glucose-unit conversion? Use the mmol/L and mg/dL blood sugar converter.
What A1C measures · Why it is a weighted average · The eAG formula · A1C-to-eAG chart · Normal, prediabetes, and diabetes ranges · A1C treatment targets · Why A1C and glucose may disagree · When A1C may be unreliable · eAG vs. CGM average and GMI · How often to test · Does a high A1C require hospitalization?
What Does A1C Measure?
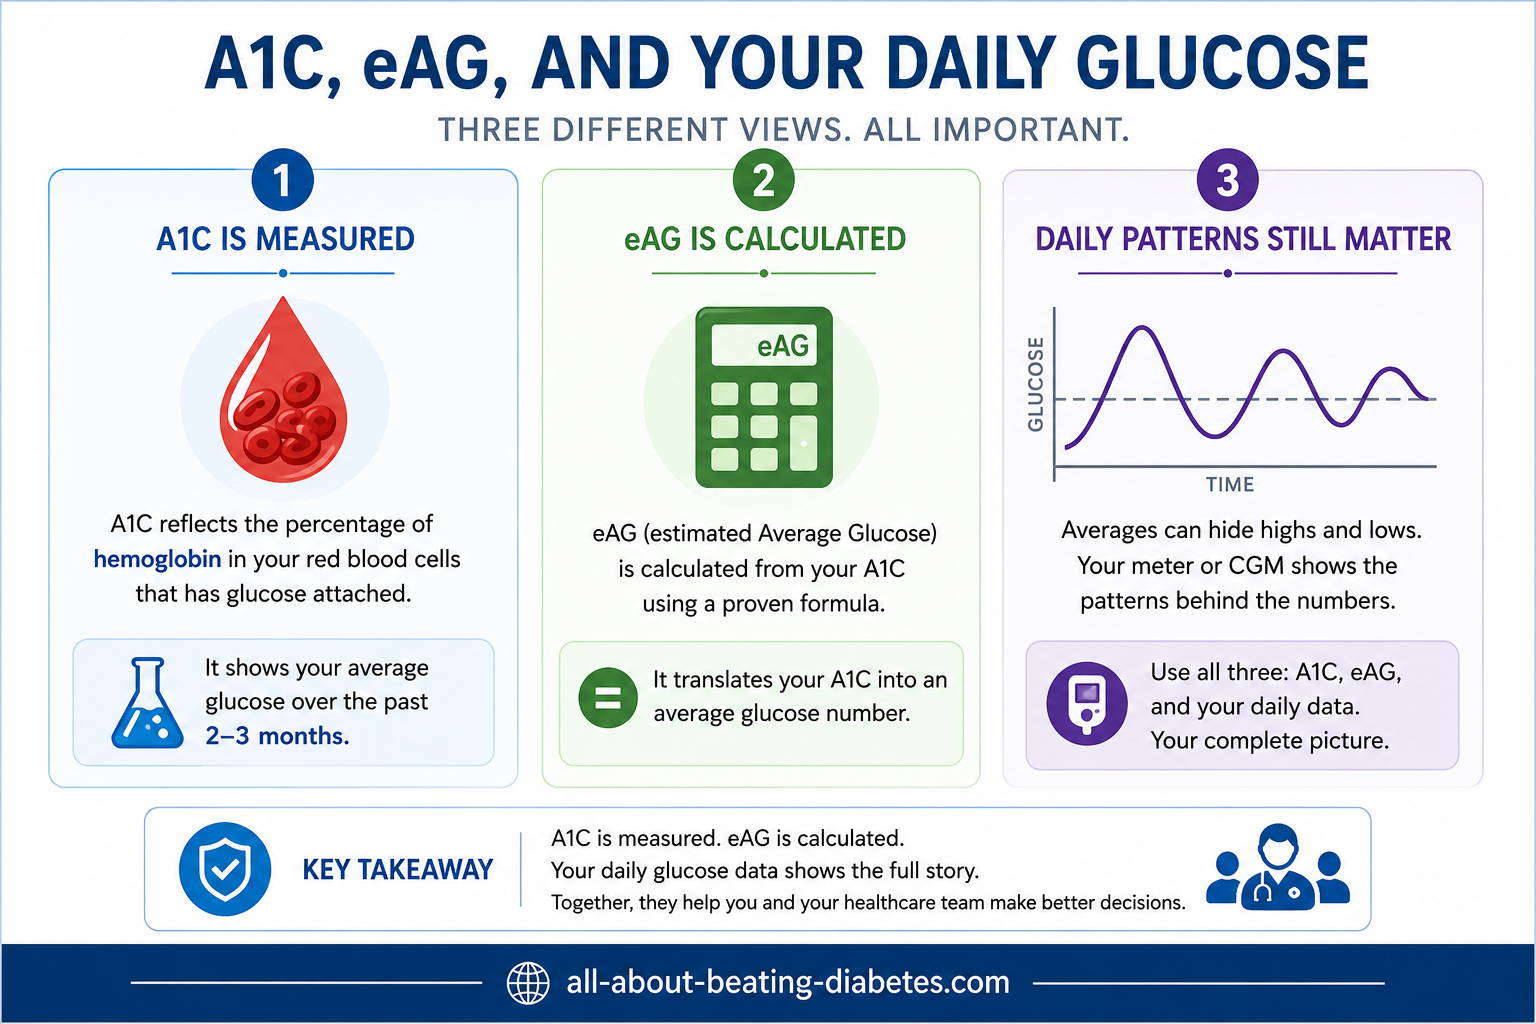
HbA1c—also called A1C, glycated hemoglobin, or hemoglobin A1C—measures the percentage of hemoglobin with glucose attached to it.
Hemoglobin is the oxygen-carrying protein inside red blood cells. Glucose attaches to hemoglobin through a natural nonenzymatic process called glycation. The higher glucose has been over time, the greater the proportion of glycated hemoglobin.
A laboratory reports A1C as:
- NGSP percentage, such as 7.0%, which is commonly used in the United States; or
- IFCC mmol/mol, such as 53 mmol/mol, which is commonly used in many other countries.
A1C does not require fasting. For diagnosis, it should be performed using an appropriate standardized laboratory method. Learn how it compares with other tests in the blood tests for diabetes guide.
Why Does A1C Reflect Approximately Two to Three Months?
Red blood cells circulate for roughly 120 days, but A1C is not a simple average of every day across four months. It is a weighted average because circulating blood contains red cells of different ages.
Glucose exposure during the most recent month contributes more strongly than exposure three or four months earlier. This is why a major treatment or glucose change can begin affecting A1C before 120 days have passed.
A1C does not directly show the current glucose level, hypoglycemia frequency, post-meal peaks, overnight patterns, or glucose variability. Two people can therefore have the same A1C but very different glucose patterns and safety risks.

How Is eAG Calculated From A1C?
The A1C-Derived Average Glucose, or ADAG, study compared laboratory A1C with frequent glucose measurements collected through continuous glucose monitoring and structured finger-stick testing. The resulting regression equation was:
eAG (mg/dL) = 28.7 × A1C (%) − 46.7
eAG (mmol/L) ≈ 1.59 × A1C (%) − 2.59
Example: A1C of 7%
eAG = (28.7 × 7) − 46.7 = approximately 154 mg/dL
154 ÷ 18.0182 = approximately 8.6 mmol/L
The reverse equation is:
Estimated A1C (%) = [eAG (mg/dL) + 46.7] ÷ 28.7
The relationship is strong at the population level but does not produce a perfect match for every person.
A1C to Estimated Average Glucose Chart
| A1C | IFCC | eAG mg/dL | eAG mmol/L |
|---|---|---|---|
| 5% | 31 mmol/mol | 97 | 5.4 |
| 6% | 42 mmol/mol | 126 | 7.0 |
| 7% | 53 mmol/mol | 154 | 8.6 |
| 8% | 64 mmol/mol | 183 | 10.2 |
| 9% | 75 mmol/mol | 212 | 11.8 |
| 10% | 86 mmol/mol | 240 | 13.4 |
| 11% | 97 mmol/mol | 269 | 14.9 |
| 12% | 108 mmol/mol | 298 | 16.5 |
The chart gives estimated averages. It does not mean glucose remained near that value throughout the day.
What A1C Levels Mean for Diagnosis
| Diagnostic category | A1C | IFCC equivalent |
|---|---|---|
| Normal diagnostic range | Below 5.7% | Below 39 mmol/mol |
| Prediabetes | 5.7%–6.4% | 39–47 mmol/mol |
| Diabetes range | 6.5% or higher | 48 mmol/mol or higher |
Without unequivocal hyperglycemia, an A1C in the diabetes range normally requires confirmation with a repeat A1C or another abnormal diagnostic test.
These diagnostic categories should not be applied as treatment labels to a person already known to have diabetes. An A1C of 6.2% while using diabetes medicine does not automatically mean the condition has become “prediabetes.”
What Is a Good A1C Target?
For many nonpregnant adults with diabetes, a common treatment goal is below 7%. This is not the correct target for everyone.
A different goal may be appropriate according to age, pregnancy, diabetes duration, severe hypoglycemia, impaired awareness, heart or kidney disease, complications, medicine burden, and personal circumstances. A lower A1C is not automatically better when it is achieved through frequent low glucose.
Learn how goals are individualized in HbA1c Explained: Good Levels and Average Blood Sugar.
Why Might A1C and Home Glucose Readings Not Match?
- the meter may be checked mainly while fasting and miss after-meal highs;
- testing may be more frequent on “good” or “bad” days;
- CGM data may be incomplete or cover a shorter period;
- recent treatment changes may affect current readings before fully changing A1C;
- glucose variability can produce the same average through different patterns;
- A1C may be altered by red-cell or hemoglobin factors;
- meter technique, strip storage, or laboratory variation may contribute.
Do not assume that the A1C is always wrong or that the meter is always wrong. Compare dates, data completeness, laboratory method, red-cell health, and glucose patterns. See A1C vs. Blood Sugar.
When Can A1C Be Falsely High or Falsely Low?
| Situation | Possible effect |
|---|---|
| Recent blood loss, hemolysis, or shortened red-cell survival | May make A1C falsely low. |
| Iron-deficiency anemia | May make A1C falsely high in some circumstances. |
| Blood transfusion | Can make A1C difficult to interpret in either direction. |
| Erythropoietin treatment or dialysis | May alter red-cell turnover and A1C accuracy. |
| Hemoglobin variants | May interfere with some assay methods or change interpretation. |
| Pregnancy | Changes red-cell turnover; pregnancy uses specific glucose tests and targets. |
| Advanced kidney or liver disease | May affect red-cell survival and create discordance. |
If A1C and repeated glucose data do not match, the clinician may repeat the test, review the laboratory method, use plasma glucose criteria, or consider another marker such as fructosamine or glycated albumin in selected situations.
eAG, Meter Average, CGM Average, and GMI Are Not Identical
- eAG: calculated from a laboratory A1C using the ADAG formula.
- Meter average: arithmetic average of the finger-stick readings actually performed.
- CGM mean glucose: average of available sensor glucose values during the selected period.
- Glucose Management Indicator: calculated from CGM mean glucose to estimate the A1C commonly associated with that sensor average.
GMI is not a laboratory A1C. CGM also provides time in range, time below range, time above range, and variability—information A1C and eAG cannot show.
How Often Should A1C Be Checked?
Measurement approximately every three months helps determine whether goals have been reached and maintained.
- About every three months is often appropriate when treatment changes, goals are not met, or glucose is unstable.
- At least twice yearly may be sufficient when glucose management is stable and goals are being met.
- Different timing may be needed during pregnancy, major illness, rapid treatment changes, or when A1C is unreliable.
What A1C Level Requires Hospitalization?
There is no single A1C level that automatically requires hospitalization. A1C reflects chronic glucose exposure and cannot show whether a person is currently dehydrated, acidotic, producing ketones, severely hypoglycemic, or mentally altered.
A very high A1C suggests prolonged hyperglycemia and needs prompt treatment review. Emergency or hospital care depends mainly on current glucose, ketones, vomiting, hydration, breathing, mental status, and the possibility of DKA or HHS.
Common Questions About A1C and eAG
Is eAG the same as fasting glucose?
No. Fasting glucose is one measurement after fasting. eAG estimates average glucose across day and night over a longer period.
Can I calculate A1C from one glucose reading?
No. Entering one reading into the reverse calculator produces a mathematically possible number but not a medically meaningful A1C estimate.
Does an A1C of 7% mean glucose stayed near 154 mg/dL?
No. Glucose may have moved above and below 154 mg/dL. The estimate does not reveal variability or hypoglycemia.
Can A1C change in one month?
Yes. Recent weeks have greater influence, so a major sustained glucose change can alter A1C before three months have passed.
Why does laboratory eAG differ from my CGM average?
The laboratory eAG is calculated from A1C, while the CGM average is calculated from sensor readings during a specific period. Biological and measurement differences can produce discordance.
Related Questions
- Why Is HbA1c 6.6% When Finger-Prick Readings Look Normal?
- Fasting Glucose 159 but Two-Hour Glucose 109: Am I Diabetic?
- How Should GTT and Insulin Resistance Results Be Interpreted?
- Why Did Glucose Rise From 91 at Bedtime to 145 in the Morning?
Related Resources
- HbA1c to Average Glucose Calculator With Interpretation
- HbA1c Explained
- A1C vs. Blood Sugar
- Blood Tests for Diabetes
- Blood Sugar Levels by Time of Day
- Dangerous Blood Sugar Levels
Medical disclaimer: This calculator and article provide general education. They do not diagnose diabetes, set an A1C goal, prescribe treatment, or determine whether emergency care is required. Do not change insulin or medicine based only on a calculated eAG or estimated A1C.
References
- American Diabetes Association: Diagnosis and Classification of Diabetes—Standards of Care in Diabetes 2026
- American Diabetes Association: Glycemic Goals, Hypoglycemia, and Hyperglycemic Crises—2026
- NIDDK: The A1C Test and Diabetes
- NGSP: HbA1c and Estimated Average Glucose
- NGSP: Factors That Interfere With HbA1c Test Results
- NGSP: IFCC Standardization of HbA1c
- Nathan and colleagues: Translating the A1C Assay Into Estimated Average Glucose