Understanding the Figures of Normal blood sugar level chart
- Home
- blood sugar levels
- normal sugar chart

When you ask what a normal sugar level chart can be, you're expecting to get the info you need to monitor your diabetes. Indeed, every chronic disease needs a proper monitoring.
Through this kind of chart, you will get the help you need.
Actually, if you don't have diabetes, but you may be in risk on having it, this blood sugar chart can help you identify a possible diabetes onset.
The following chart describes what the blood sugar levels can be in different types of test you use to measure it.
Meanwhile, if you're a diabetic, the chart, will help you monitoring and managing your condition.
In this way you'll have a great chance to see, compare and monitor your diabetes at the same time.

As you may see from the chart above, what you can do is to keep your blood sugar levels under 140 mg/dl.
Only like that you can have a great diabetes control. It all depends on what efforts you put to succeed in your hard battle.
Sometimes, you may need to design your own normal blood glucose level charts.
You can just record your glucose meter results anytime you measure your blood sugar during day.
Getting this chart will help you better understand how well you've been managing diabetes. Furthermore, you will give precious information to your doctor in order to take the best decision when it comes to treatment.

Diabetes complications Questions or Problems? Get Help Here
This is the place where you can ask a question about any aspect of diabetes complications.
It's free and it's easy to do. Just fill in the form below, then click on "Submit Your Question".

Recent Articles
-
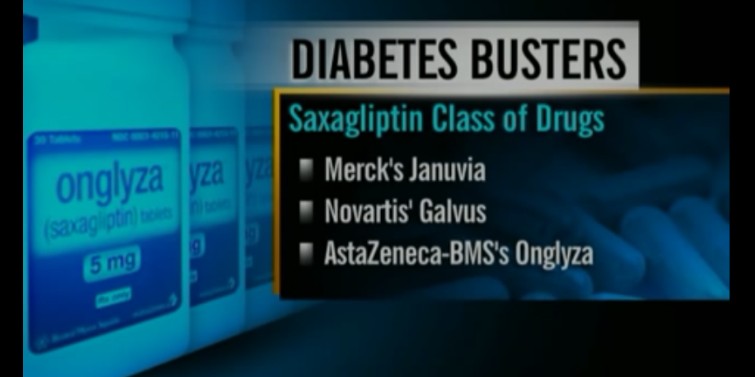
Taking Onglyza or Nesina is it safe for your Heart?
Feb 24, 25 10:53 AM
 Saxagliptin/Alogliptin (DPP-4) heart failure risk in diabetes. Use SGLT2/GLP-1 for high CV risk. ADA/ESC guidelines advise caution.
 -
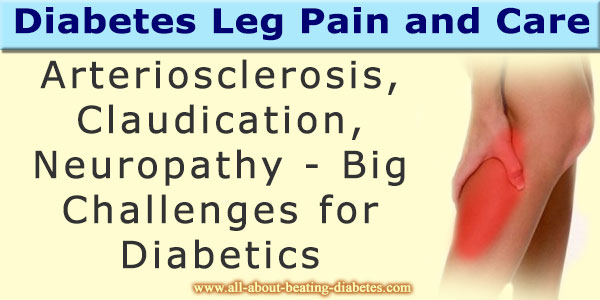
Diabetes Leg Pain Relief
Jul 26, 24 04:59 PM
 Diabetes leg pain relief involves managing blood sugar, regular exercise, pain medications, proper footwear, daily foot care to prevent further complications.
 -
Diabetes Blood Sugar Level - Key insights in Managing Diabetes
Jul 15, 24 05:37 PM
 How to read and interpret the diabetes blood sugar level? Learn how to manage diabetes effectively by understanding blood sugar levels, their impact on health, and tips for maintaining optimal control…
Ask question and get a personalised answer
Recent Articles
-
Taking Onglyza or Nesina is it safe for your Heart?
Saxagliptin/Alogliptin (DPP-4) heart failure risk in diabetes. Use SGLT2/GLP-1 for high CV risk. ADA/ESC guidelines advise caution. -
Diabetes Leg Pain Relief
Diabetes leg pain relief involves managing blood sugar, regular exercise, pain medications, proper footwear, daily foot care to prevent further complications. -
Diabetes Blood Sugar Level - Key insights in Managing Diabetes
How to read and interpret the diabetes blood sugar level? Learn how to manage diabetes effectively by understanding blood sugar levels, their impact on health, and tips for maintaining optimal control…


