Natural Cures For diabetes E-book & new Updates

What Is the Normal Blood Sugar Level?
What is the normal blood sugar levels for diabetics?
What about the normal range of blood glucose in non-diabetics and pre-diabetics?
How to keep my blood sugar within the normal range?

Before answering these questions, I wanted to remind you that there exist many tests of measuring blood sugar, including fasting (FBST), oral tolerance glucose test (OTGT), random blood glucose (RBG), blood sugar test after eating (BSTAE) and A1C test.
Generally, the aim is to obtain normal levels of glucose in each of diabetes tests. However, diabetics fail to have such results, therefore, ADA recommends to set personal goals for blood sugar according to the health status and other comorbidities patients have.
Now, in general, the normal range of blood sugar is set equally for diabetics, pre-diabetics or healthy subjects. The only change made is related to the type of test performed.
All the blood sugar level figures are expressed in mg/dl (for the American BG system) and in mmol/l (international BG system). However, it is also very easy to convert mmol/l in mg/dl .
Random Blood Glucose Test - The Normal Range
This is a very simple test. I am sure that the majority of you can perform on their own at home anytime or at any other place. The following chart gives the normal range of glucose in this test:
As you may see, the normal range falls between 80 and 100 mg/dL. Any other results higher than 100 falls into pre-diabetic or diabetic "category":). Meanwhile, the levels less than 80 would be considered as hypoglycemia.
In the fasting blood sugar test, glucose levels of 100 to 125 mg/dl are considered as pre-diabetes; while levels of 126 mg/dl and above suggest the possibility of having type 1 or 2 diabetes.

Meanwhile, when you get blood sugar levels higher than 200 mg/dl, you may have type 1 or 2 diabetes. You should repeat your blood glucose tests to confirm the diagnose.
Oral Glucose Tolerance Test - The Normal Level
In this test, the ranges 140 mg/dl and below are considered as normal; while pre-diabetes is suggested for levels between 140 and 199 mg/dl, diabetics are diagnosed with levels above 200 mg/dl.

The Normal Level For A1C Test
The A1C test is performed to measure the average of your blood sugar levels the last 3 months. The results of this test are expressed in percentage. The normal range falls in between 4 and 6 percent. A1c levels of more than 7 percent show a bad management of your diabetes, and need future changes.

As you may see from the above blood glucose charts, only a good control of diabetes can keep your sugar blood level at an optimum (or average) and steady (near normal) range .
Overall, here's how your figures should look like (as in the following diabetes chart):

Simple Steps of Beating Diabetes Naturally
1 - First, make your own decision to change and control diabetes, then start your diabetes management strategies.
2 - Start making some changes in your lifestyle habits.
3 - Try to follow the right dietary strategy (with right foods and diet).
4 - Consider some natural remedies for diabetes as a good natural alternative in keeping blood glucose within the normal ranges.
A good control of blood sugar can be taken even when using the extracts of some special herbs.
5 - If (1 - 4) fail, it's a must to start the drug therapy (but, you must also consider their side effects).
Recent Articles
-
Best Choices as Diabetes Foods
Feb 20, 24 02:00 PM
 What diabetes foods to choose in diabetes? High carb or low carb foods? Foods that lower sugar?
 -
Chart for normal fasting blood sugar levels
Jan 18, 24 03:57 PM
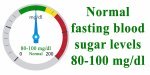 A chart of normal fasting blood sugar levels visually represents the typical range of blood glucose concentrations after an overnight fast between 80&100mg/dl
 -
Polymyalgia Rheumatica Diabetic with insulin therapy
Jan 15, 24 02:41 PM
How to treat polymyalgia rheumatica with diabetic complications, and on insulin therapy, sugar 98 losing cosciousness.
Ask question and get a personalised answer
Recent Articles
-
Best Choices as Diabetes Foods
What diabetes foods to choose in diabetes? High carb or low carb foods? Foods that lower sugar? -
Chart for normal fasting blood sugar levels
A chart of normal fasting blood sugar levels visually represents the typical range of blood glucose concentrations after an overnight fast between 80&100mg/dl -
Polymyalgia Rheumatica Diabetic with insulin therapy
How to treat polymyalgia rheumatica with diabetic complications, and on insulin therapy, sugar 98 losing cosciousness.


New! Comments
Ask A question Or Leave a comment.